Species Protection Index
The Species Protection Index (SPI) measures how well protected areas conserve habitat for species. The SPI reflects how adequately conservation areas in a region represent the region’s biodiversity, with a particular emphasis on the region’s native or endemic species. As part of a new generation of data-driven, species-level indicators, the SPI is designed to support biodiversity assessment and conservation decision making. The SPI is a GEO BON (Biodiversity Observation Network) biodiversity indicator used for monitoring and reporting on national progress towards global biodiversity goals and targets, and one of several new biodiversity indicators adopted in the Global Biodiversity Framework of the Convention of Biological Diversity in 2022.
The SPI directly addresses the Protected Area Target of the GBF which stipulates an increase in protected areas to achieve the goal of “healthy and resilient populations of all species” and “reduced extinction rates”.

National SPI values appearing in the SPI National Report Cards are calculated based on species protection scores (SPS). SPS measures how much of a species’ range or population (e.g. its habitat-suitable range1) is currently protected (realized representation) relative to how much conservation area we think is needed for its population to thrive. There is no gold standard for determining how much area a species needs, but we can apply an intuitive rule of thumb: the rarest species with small range sizes generally need the most protection, and the most widespread and common species probably need the least. In practice, many other conservation principles will also influence species persistence through time such as population size and trends and protected area management effectiveness. However, this rule of thumb is a useful proxy for setting area-based conservation targets for species. We set area targets of 100 percent for species with range areas less than 1000 km2,15 percent for species with range areas greater than 250,000 km2, and use a log-linear relationship for any species in between.
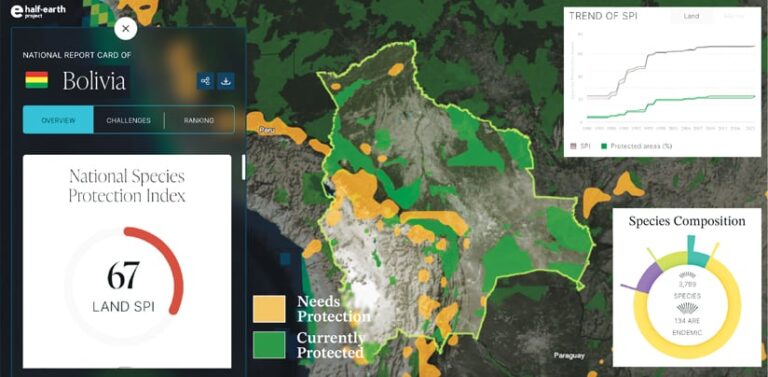
The SPI applies representation targets equitably at the national level, with national SPS calculated as the percent of the globally-targeted adequate representation level for that species (say, 50 percent for Species X) achieved by a country. A species that has met its conservation target (Species X: >=50 percent of range protected in a country), will have an SPS of 100; a species halfway to meeting its target (Species X: 25 percent of range protected in a country) will have an SPS of 50.
A country’s SPI value is then given as the average SPS, weighted by their respective stewardship (country-endemic species weigh most). SPI values range from 0 to 100, where a value of 50 means that on average species are half-way to sufficient representation in conservation areas. Conservation area additions that improve species representation will increase the SPI value.