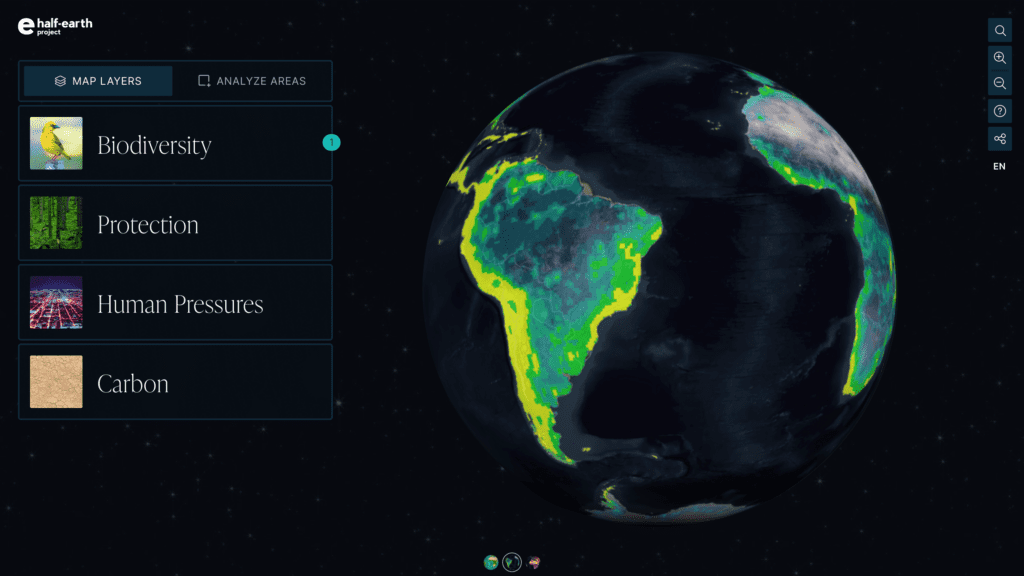
NRC Features on the Half-Earth Project Map
The Species Protection Index (SPI) is one prominent example of a family of metrics — collectively known as Essential Biodiversity Variables — vital for guiding a global strategy of biodiversity conservation and an integral part of international policy frameworks.
The SPI provides an estimation of how well each country is meeting conservation targets by considering the amount of land or sea currently protected, the number of rare species, as well as the total number of species found both inside and outside protected areas. Using the accumulation of these data, the National Report Cards provide an answer to the question of how well each country is doing to protect the biodiversity it has stewardship over.
On the Half-Earth Project Map, each country is colored by their SPI value. From no color at 100, progressively lighter shades of purple as the SPI value increases, and red to bright orange as the SPI reaches 0. Generally, the SPI is higher in countries effectively managing species diversity and promoting conservation within its borders. A lower SPI score demonstrates a need for more – or changes to – conservation efforts.
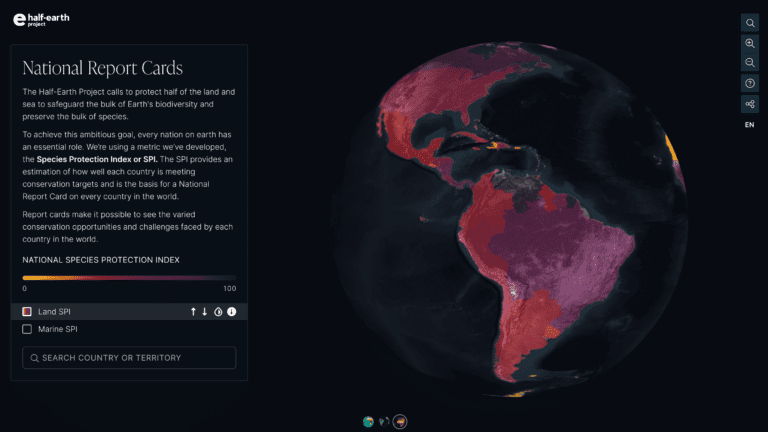
The SPI reflects not only the volume of conservation efforts but how intentional those are to protect the unique species in that area. A country could have a lower SPI, even with lots of habitat conserved if they weren’t protecting the rare species that it is uniquely more responsible for.
On the Half-Earth Project Map, this layer reveals which areas within each country would contribute more to the conservation of species habitat, while also marking the locations of current protection. NRCs on the map can be shared via embeddable URL links.
To emphasize those countries with high biodiversity rarity, the visualization focuses on the number of endemic species.
A country with endemic species is solely responsible for the management of protected areas that assure the conservation of those species. The range of endemic species is often smaller than those found in multiple countries, placing additional responsibility on individual countries to protect almost 100 percent of a species’ range. Understanding the composition of species in terms of endemism is important for understanding the challenges a country may have in trying to achieve the maximum Species Protection Index.
Species Protection Score
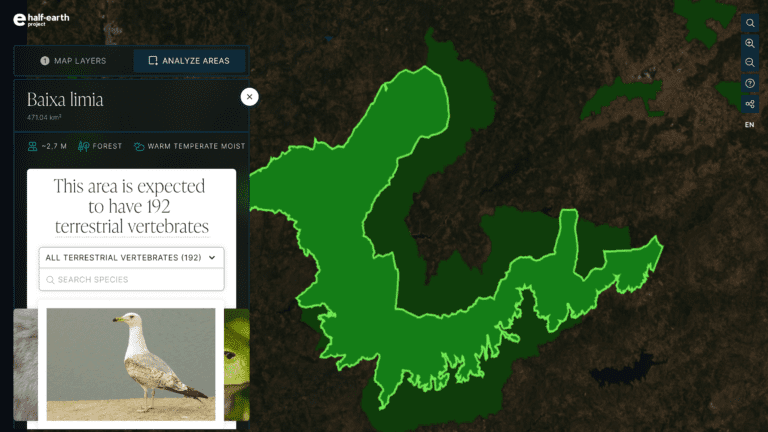
From the sidebar of the NRC on the Half-Earth Project Map you can explore information about the land vertebrates whose habitat lies within the country’s borders.
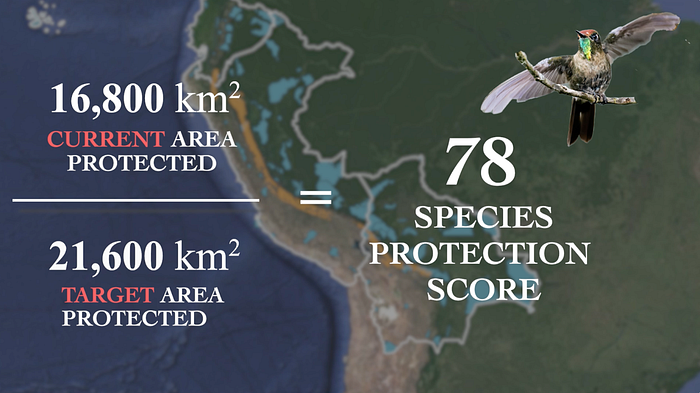
The species stewardship element of the NRC expands the concept of joint responsibility for a species by considering all of the land vertebrates in each country. This makes it possible to see the number of countries that share the stewardship of a species. The Species Protection Score goes further by providing an assessment of the protection accomplished per species, per country.
The Species Protection Score (SPS) differs from the Species Protection Index (SPI) in that it reflects the level of protection an individual species receives within a given country, a conservation target.
An SPS value indicates how close a country is to meeting a species’ conservation target, relative to the amount of species habitat it has stewardship over. A single species will therefore have a unique SPS for each country that overlaps with its global range. SPS values are presented as ranges (e.g., 75-100) to reflect some of the spatial uncertainty associated with species distributions.
Challenges
To better understand the challenges countries face when planning conservation action, the ‘Challenges’ portion of the National Report Cards on the Half-Earth Project Map explores the relationships between the Species Protection Index and the various socio-political and biodiversity indicators of each nation. The scatter plots illustrate some of the similarities among countries and the shared social challenges that need to be considered to ensure equitable global biodiversity conservation. By grouping countries by their similarities, this part of the NRC can foster shared learning and facilitate the replication of successful conservation efforts.
The concept of species stewardship is one filtering option on the map. For any selected country, this filter reveals the ten countries with the largest number of species in common, providing insight into which countries should work together to yield the most effective protection for the greatest number of species. Many species are found in numerous countries and the entire species range should be considered when developing conservation plans to protect species wherever they are found. Joint species management and cooperation is often critical.
Country Ranking
The ranking element of the National Report Cards on the Half-Earth Project Map provides, at a glance, an overview of species composition, human modification, protection status, and Species Protection Index ranking. With this ranking it’s easy for users to identify which countries have a high proportion of endemic species, a high level of protection, or a high need for additional protection.
Areas of Interest
In the U.S. and Canada, the Half-Earth Project Map now offers 1km species richness and rarity layers at an unprecedented level of detail, beneficial to conservation planning at actionable scales in North America. These include species of mammals, birds, reptiles, butterflies, and amphibians. We continue to update the map with higher resolution and additional species.
Users of the map can draw or upload their own “area of interest,” ranging from 1000 sq.km up to 35,000 sq.km. Users can easily name, share, and save a URL for easy reference of this area at a later time. In their area of interest, users can toggle through the unique combination of species found in a given area and then survey how local protections contribute to the protection of each species’ global range. Users will find that additional species groups have been added to the map beyond vertebrates to increase the view of biodiversity to include insect groups such as ants, dragonflies, and butterflies.