This series of lessons focuses on the many species of hummingbirds to prompt students to ask questions about species diversity, habitats, interactions, and conservation. The lessons focus on several exceptional online resources, based on authentic research data, that support instructor-guided student-inquiry. Each lesson within this series may be used alone or in any combination. A video collection also offers preparatory guidance to teachers on using the different interactive tools.
20 - 50 mins.
Six lessons, ranging from 20-50 minutes each.
Subjects
Middle School Life Science, High School Biology, AP Biology, Environmental Science, AP Environmental Science, College Environmental Science, Natural Resources, Ecology, Conservation Biology, Environmental Studies
Build student skills in data analysis and mapping tools to prompt scientific inquiry into important questions concerning species interactions, and why different species live where they do
Students are also led to question issues of data completeness and evenness
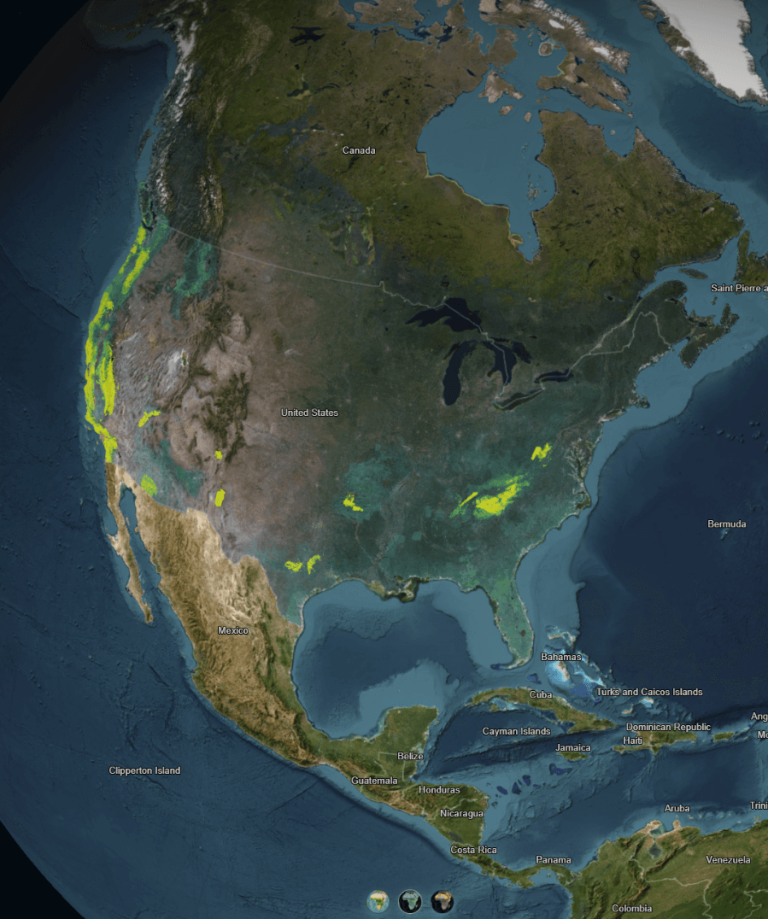
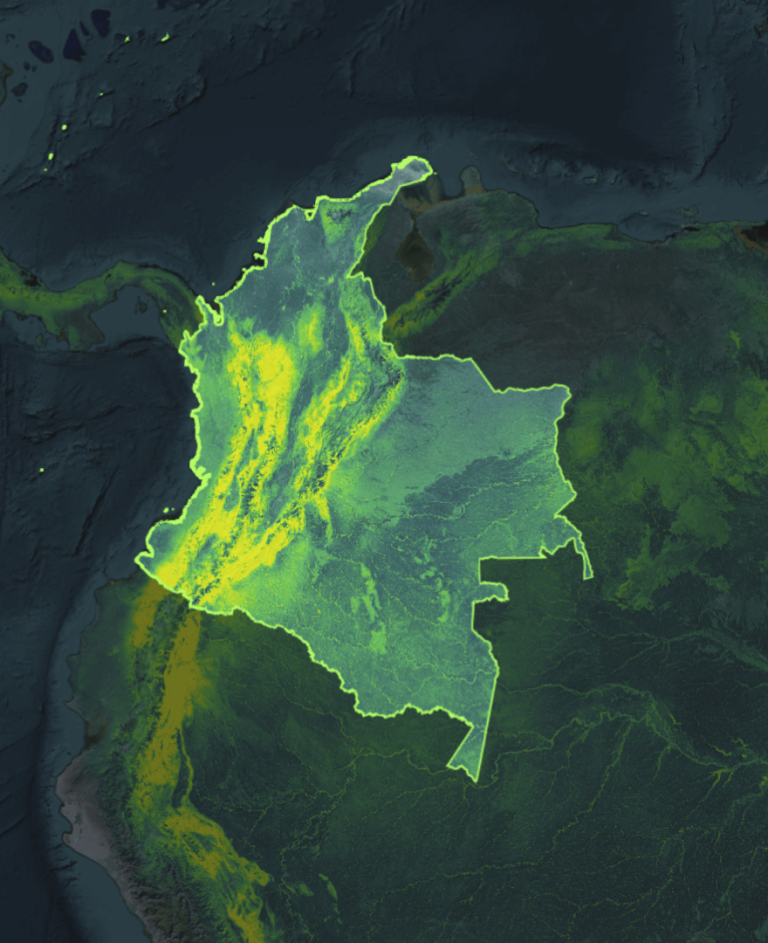
Interactive tools encourage students to explore local and global patterns of hummingbird biodiversity particularly related to species range, richness, and rarity
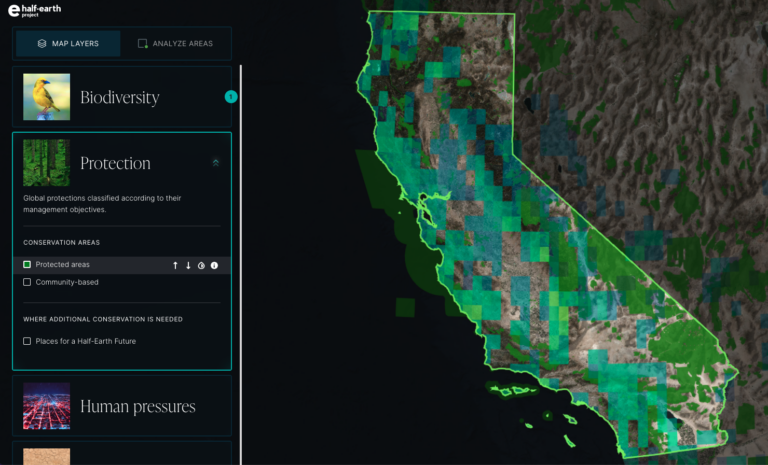
Spark inquiry by asking students to identify the range or richness of hummingbirds on the Half-Earth Map. This can prompt discussions about why hummingbirds appear in one area but not another, for example. Alternatively, students can zoom in on a particular section of the map and apply data layers to explore human impacts on hummingbird distribution.
Data visualization and animation from resources like eBird can demonstrate the power of citizen science and real-time, interactive data tools.