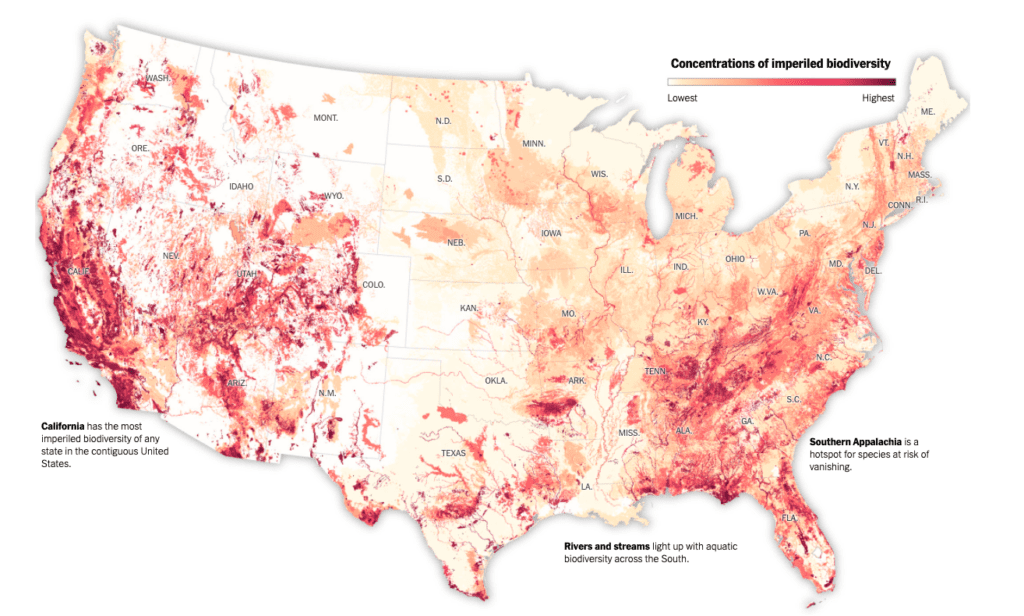
Let your eyes wander to the areas of this map that deepen into red. They are the places in the lower 48 United States most likely to have plants and animals at high risk of global extinction.
It’s the most detailed map of its kind so far. Animals like the black-footed ferret and California condor are represented, but so are groups often left out of such analyses: species of bees, butterflies, fish, mussels, crayfish and flowering plants. Not included are gray wolves, grizzly bears and other wildlife not at risk of global extinction.
Maps like these offer a valuable tool to officials and conservationists who are scrambling to protect biodiversity. That work is critical, because scientists say humans are speeding extinction at a disastrous pace.
“There are hundreds of species known to be globally critically imperiled or imperiled in this country that have no protection under federal law and often no protection under state law,” said Healy Hamilton, chief scientist at NatureServe, a nonprofit conservation research group that led the analysis behind the map.
By highlighting areas where land is permanently protected for biodiversity, in green below, you can see where the habitats of imperiled species are outside of conservation zones.
Right now, about 13 percent of the United States is permanently protected and managed primarily for biodiversity, according to the United States Geological Survey. The Biden administration has set a goal to conserve and restore 30 percent of U.S. lands and waters by 2030. It’s part of a larger global push, known as 30×30, to protect more land and water worldwide.
The analysis found that the habitats of hundreds of imperiled species were entirely outside of the green areas above.
There is the Cassia crossbill, a finch with a twisty beak found in a single county in Idaho. There’s the tiny patch-nosed salamander in northern Georgia and across the border in South Carolina. And there’s the star cactus, which resembles a green sand dollar with a bright yellow bloom. It exists in only two locations, one in southern Texas and the other in northern Mexico.
Even when species are protected under federal or state laws, they are typically more vulnerable outside of lands that are managed to protect biodiversity, Dr. Hamilton said. Officials may not know where they are. Private landowners may be reluctant to report them or allow surveys for fear of the restrictions that could follow if they are found.
To identify concentrations of imperiled biodiversity, the scientists created models for more than 2,200 species based on where they are known to exist and their habitat needs. The research, published in the journal Ecological Applications, and the related maps were a partnership between NatureServe and its network of state partners, the geographic mapping platform Esri, and the Nature Conservancy.
It is one of many efforts to measure biodiversity in the United States and around the world. Some include a much larger number of species. Others note features like potential wildlife corridors.
According to Walter Jetz, an ecologist who leads Yale University’s biodiversity mapping efforts, it’s essential that policymakers make data-driven decisions about which areas to protect. Otherwise “you might gain a large percentage of area protected but you have done very little in actually safeguarding species.”
Across the continental United States, private land makes up almost 70 percent of areas with important concentrations of unprotected imperiled species, the researchers found.
The Texas Hill Country region southwest of Austin, growing fast and with little protected land, is one example. Despite pressure from housing developments and groundwater depletion, habitat for six imperiled species — a warbler, a bat, two salamanders and two plants — still exists.
The geographic precision now available, Dr. Hamilton said, can allow private individuals and conservation groups to focus more accurately on preventing extinctions. The researchers cited a variety of approaches, like tax incentives, to encourage the protection of certain species on private land.
Focusing Efforts
Many conservationists emphasize that the places with the most imperiled species aren’t the only important ones to safeguard.
“Species that are now abundant aren’t going to be if we don’t protect some of these other habitats,” said Brian O’Donnell, the director of Campaign for Nature, a coalition of conservation groups.
California is leading the way in tackling some of these challenges. It has more land under biodiversity protection than any other of the lower 48 states, but it’s also home to high concentrations of imperiled species that live outside of those areas.
“We have this tremendous biodiversity, but we also have these major stressors, including that we built ourselves into the fifth-largest economy in the world with 40 million people,” said Wade Crowfoot, California’s natural resources secretary.
California committed to 30×30 even before the federal government did. Officials there have pledged to bring an additional 6 million acres under conservation, with goals that include protecting species and storing planet-warming carbon.
Nationwide, the Interior Department is seeking public input until March 7 on questions such as what should count as conserved land and waters under President Biden’s 30 percent commitment.
View the Maps at https://www.nytimes.com/interactive/2022/03/03/climate/biodiversity-map.html?smid=url-share
Map source: NatureServe
Image sources: Golden-cheeked warbler via U.S. Fish and Wildlife Service; tricolored bat via Missouri Department of Conservation; Jollyville Plateau salamander via Piers Hendrie; Cockerell’s bumblebee via Greg Ballmer; Sacramento Mountains thistle via Heather Hollis/U.S. Forest Service; White Mountain false pennyroyal via Robert Sivinski; Escambia map turtle via Jim Godwin; Narrow pigtoe and round ebonyshell mussels via Florida Fish and Wildlife Conservation Commission, Freshwater Mussel Conservation Program